Basic operating principles of the Tracker
The tracker is described in several publications. The following page gives a simple description of the instrument and the theory of the measurements it is possible to make using it.
Description of the Instrument
1 syringe piston actuator
The drop is formed, automatically with a volume and formation speed defined by the user, at the tip of a needle fitted to a motor driven syringe. By choosing a suitable syringe it is possible to form either small drops (less than 1 µl) or large drops (several hundreds of microliters). The software enables the needle tip to be set vertically so only symmetric drops are formed. A straight needle is used for the pendant drop configuration and a U-shaped needle for the rising drop configuration. The temperature of cuvette and the syringe can be controlled (between -20°C and 80°C) by using a circulating bath.
2 Sample Cell
As with the syringe, the cuvette’s temperature is controlled using a circulating bath. For volatile materials measurements of the surface tension can be completed in saturated atmosphere.
3 Light source
The light source is an integrating sphere type, which gives homogeneous illumination in all the directions. This design gives a uniform lighting of the drop, and hence a homogeneous contrast of the drop’s contour on a light background.
4 Lenses + CCD Camera
A telecentric lens system is used so that the magnification does not depend on the distance between the camera and the drop. Therefore the optical calibration only needs to be completed when the optical system has been modified and not between samples. Also this type of lens only causes a small optical distortion (for which the software applies a correction). The CCD camera with 320x256 pixels collects 25 images per second.
5 Instrument Control
The data is acquired and the instrument is controlled by a Windows 98 computer, equipped with “frame grabber”, A/D data acquisition card and motor control card. The software enables the user to both set up the instrument (ensuring the needle is vertical, volumetric calibration of the syringes, optical calibration, etc) and take data (images, contact angles, temperature, etc).
Measurement of the interfacial tension
The interfacial tension between the two fluids is determined by forming a drop of the first fluid at the tip of a capillary submerged in a cuvette containing the second fluid and, via digital processing, comparing its shape with a theoretical drop shape.
The drop shape is due to the opposition of interfacial tension and gravity. The interfacial tension gives the drop a spherical shape, whereas the gravity elongates it. Thus the drop appears to be pear-shaped. The influence of the interfacial tension on the shape of the drop can be observed during the adsorption to the surface of a drop by any surfactant. As shown below the drop becomes more and more elongated, the area of the interface increases and the interfacial tension decreases with time.
 t=0mn ----- t=1mn ----- t=2mn ----- t=3mn
The calculation of the interfacial tension is achieved using the two following equations:
the Laplace-Young equation:
and the equation describing the equilibrium between the interfacial tension and gravity for the drop:
where:
DP is the pressure difference across the interface, resulting from the curvature of the interface,
g is the interfacial tension,
R and R' are the main radii of curvature of the interface,
x and z are the coordinates of point M on the drop,
q is the angle of the tangent at M to the vertical,
V is the volume of the fluid under the plane of altitude z,
rh and rl are the densities of the two fluids and
g is the acceleration due to gravity.
The computer is able to carry out up to 12 calculations of the interfacial tension per second. When faster kinetics need to be studied, it is possible to record a film of the images (25 per second) of the drop and to process them (to calculate the interfacial tension) after the experiment.
Determination of the Rheological characteristics of an interface
A change in the area of the interface, by increasing or decreasing the volume of the drop, generates a variation of the interfacial concentration of surfactant adsorbed at the interface, the resulting change in the interfacial tension can be recorded. This response describes the viscoelastic rheological behavior of the interface. It is caused by the properties of the surfactants at the interface.
The surface area variations of the interface are created by controlled variations of the volume of the drop. They are programmed by the user and automatically implemented by the computer.
Several types of time varying deformations are available. The simplest are step deformations as in the explanation below, or periodic deformations (periodic deformations make it possible to track the variations of the rheological characteristics of the interface, as explained in the following section).
When a step dilatation DA of the area of the interface is created, the TRACKER records a step increase Dg of the interfacial tension. This step is due to the sudden decrease of the interfacial concentration due to the sudden increase of the area of the interface. The gradual decrease of the interfacial tension which sometimes follows is called the "relaxation of the interfacial tension" and is due to the adsorption of surfactants. The interfacial elasticity is equal to the ratio:

and is called the "GIBBS elasticity".
Determination of the time dependent Rheological characteristics of an interface
The viscoelastic properties of the interfaces are correlated to the stability of the emulsions and foams. Their evolution with time makes it possible to predict the system’s short and long term stability and to understand a lot of interfacial phenomena which are commonly known as “ageing of the interfaces”.
To determine the evolution of the interfacial elasticity with time, it is not possible to make successive area increases as that would make the drop detach from the tip of the capillary. Therefore it is necessary to make periodic variations of the interfacial area. The instrument can produce these (e.g.: through sinusoidal variations of the volume of the drop) and automatically calculate the evolution of the viscoelastic properties of the interfaces with time. The sinusoidal is the simplest area variation, and also enables the easiest interpretation of the results. The response of the interfacial tension is periodic, as shown below
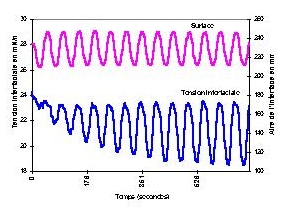
Response of the interfacial tension variation at the bitumen/distilled water interface (140°C) to a sinusoidal oscillation of the interfacial area
The rheological characteristics of the interface are calculated by FOURIER analysis. The deformation of the interfacial area
 is considered as the input and the response of the interfacial tension
  as the result. The transfer function is the complex viscoelastic modulus of the interface.
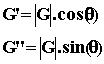
It is possible to calculate, at any moment of the recorded experiment, the complex viscoelastic modulus of the interface (giving the real and imaginary parts, modulus and phase angle).
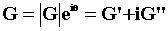 with:
with:
Hence it is possible to calculate the variations of the viscoelastic modulus with time.
Back to the instruments page